 Contact Us


The On-Screen Statistic is a tool to analyze the render output. It displays useful information about the status and the settings of each output.
Furthermore, it displays lines, running from left bottom corner to top right corner, generated by the render engine itself, which allows you to analyze if i.e. either the content or the render engine runs choppy.
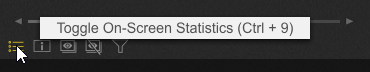
The On-Screen statistic can be enabled and disabled for assigned outputs only within Pixera in two ways. On the one hand with the button in the bottom left corner in Mapping Tab - Live and on the other hand with the shortcut Ctrl+9.
The statistic always acts like a top most overlay of the render engine.
Warning
Preview Screens in the PIXERA workspace will also show this overlay, those do not represent the same values as the actual Output.
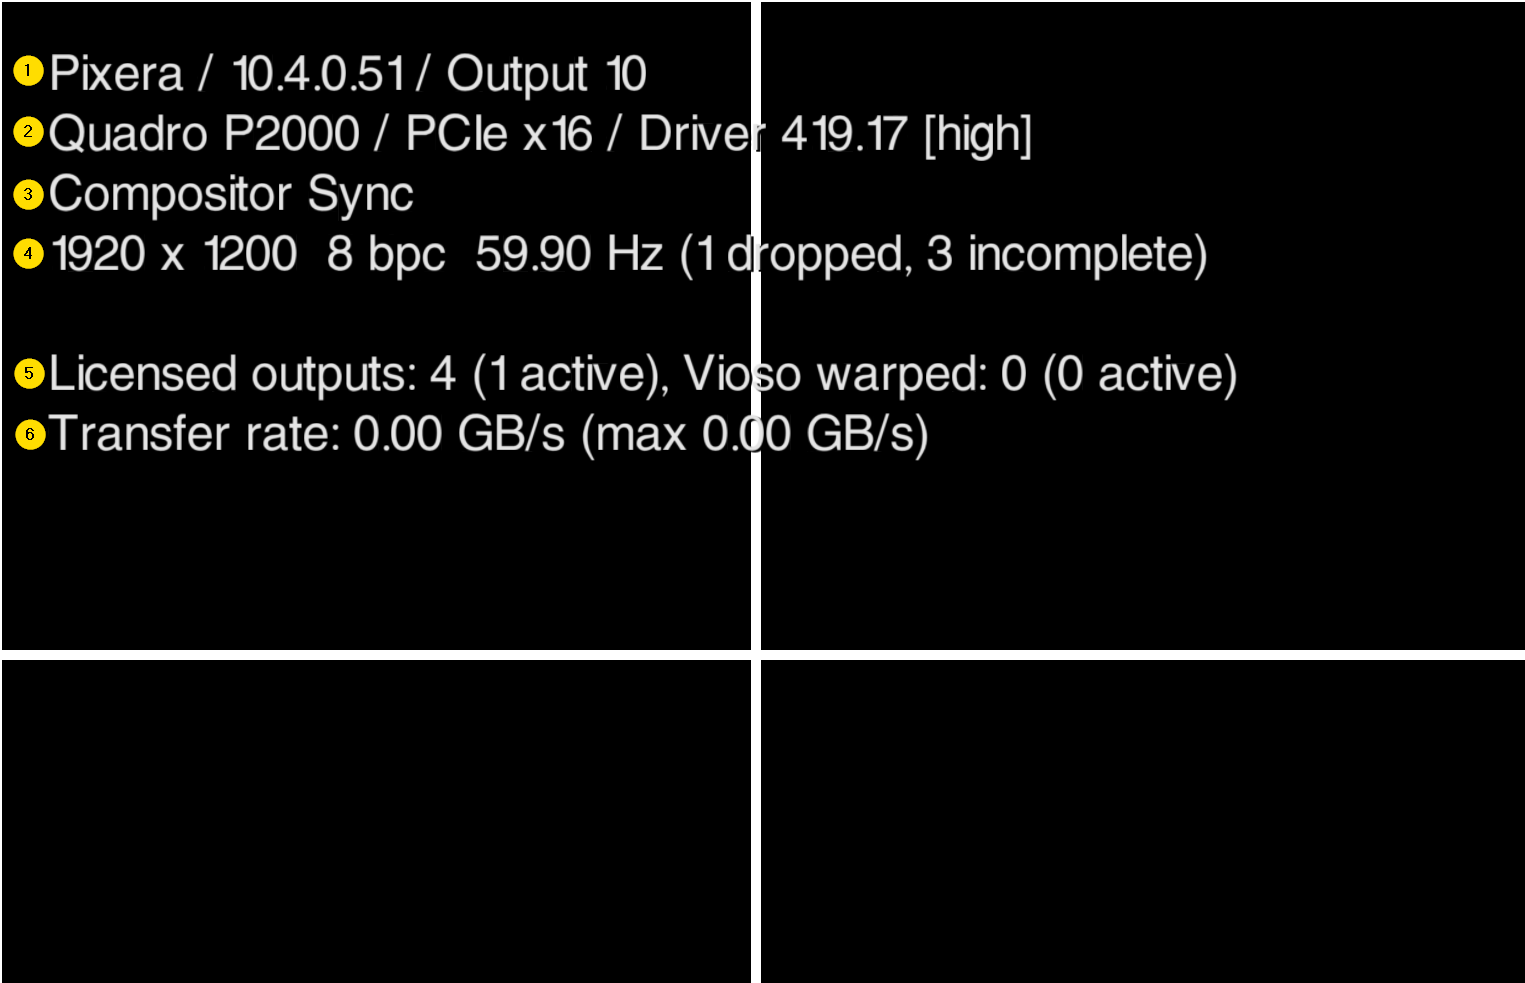
- IP address and output enumeration
- Graphics cards, used slot on main board for graphics card, used graphics card driver
- Currently used Synchronization
Info
The sync state appears when the output was active once during the runtime of the engine, the readout is done during initializing of the output rendering.
This is not rechecked during runtime!- Compositor Sync - synchronization via Windows10 DWM
- Swap Group Sync - synchronization via Nvidia Quadro Sync
- V-Sync - synchronization via monitor refresh rate
- Output Settings: Resolution, bit depth, refresh rate
-
dropped frames - Frames which the render engine cannot load into the back buffer
-
incomplete frames - Frames that the render engine cannot load completely into the back buffer, for example because the time to open and load the frame into the back buffer is longer than the frame length.
-
dropped frames - Frames which the render engine cannot load into the back buffer
- Licensed outputs
- current data read rate from the hard drive that this output takes up
Note
The current render engine is unable to work correctly with different refresh rates on one system.
On-Screen Statistics for Preview only
It is possible to enable the On-Screen Settings in the preview only without activating it on the outputs.
This is usually done to analyze the preview only.
To switch the On-Screen Statistics on for Preview select “Settings - General - GUI Rendering" and enable “Toggle On-Screen Statistics in Preview”

Scan Line Effect
The ‘Scan Lines’ effect allows you to place so-called scan lines over an existing video in PIXERA, which run from bottom left to top right.
These scan lines make it easy to determine whether tearing (asynchrony) is occurring.

The advantage of this effect over on-screen statistics is that it can be applied to any content and can therefore be scaled up across the screens as required.
On-screen statistics, on the other hand, are only displayed per output. Only if the outputs are combined via a mosaic can the on-screen statistics be seen across all outputs.
For more information, please see the article Scan Line Effect
Pixera 2.0.172 | 16. October 2024 | JB