 Contact Us


SELECTIVE PERFORMANCE MONITORING
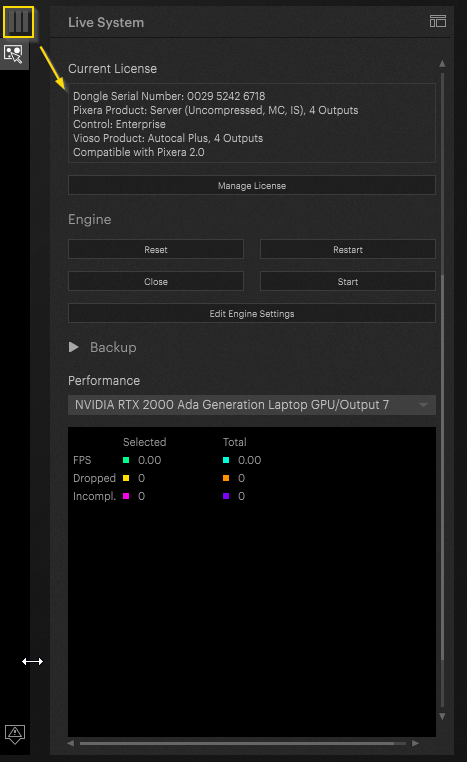
From 2.0 onwoards new performance metrics are available in PIXERA. They can be accessed in the mapping tab under live systems.
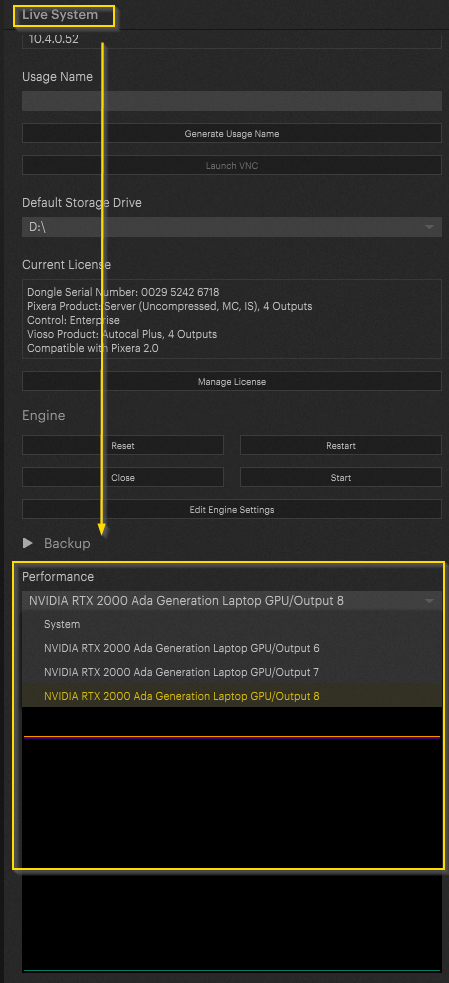
Switching between the individual output performance and general system performance is available.
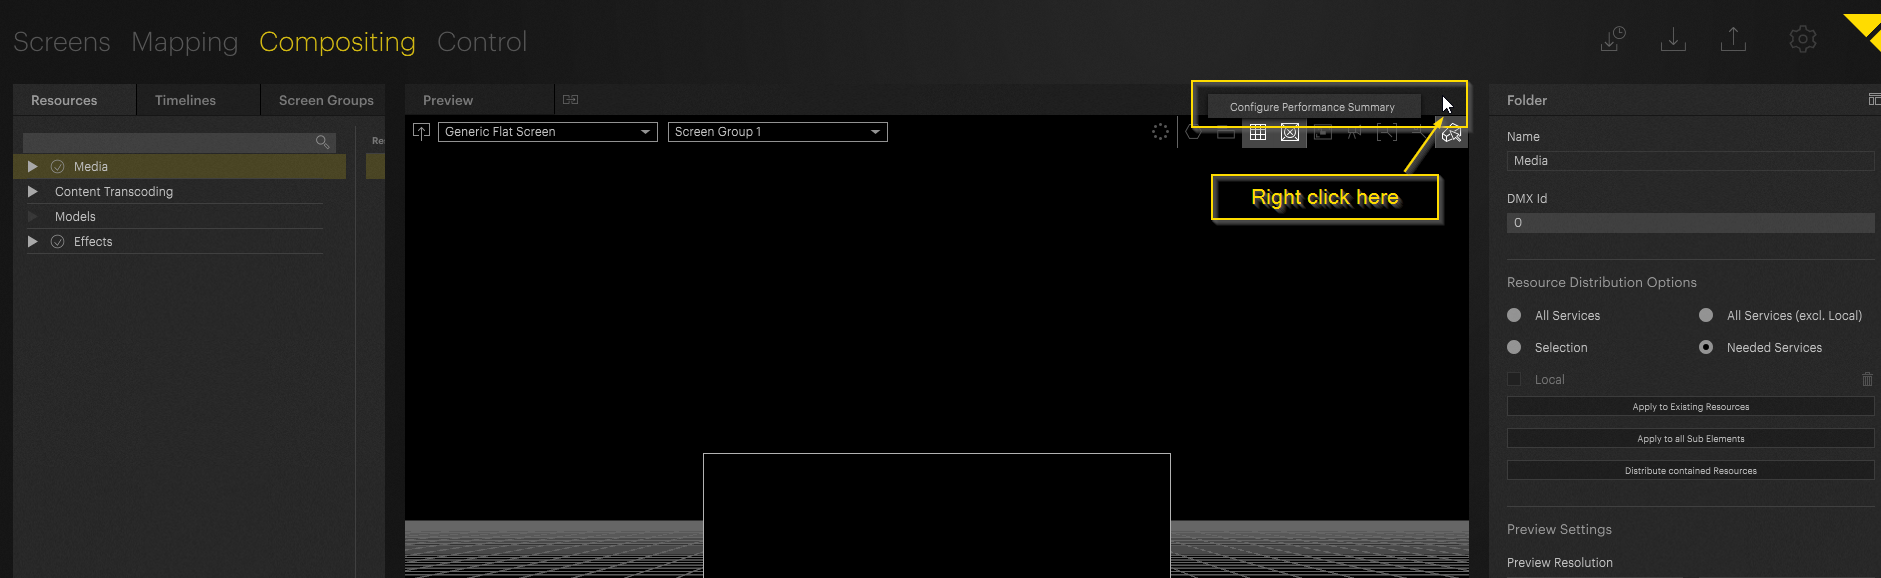
A new feature in the Compositing Tab enables the user to display small performance metrics above the Preview. To activate this feature, navigate to the right most top corner of the preview and right - click:
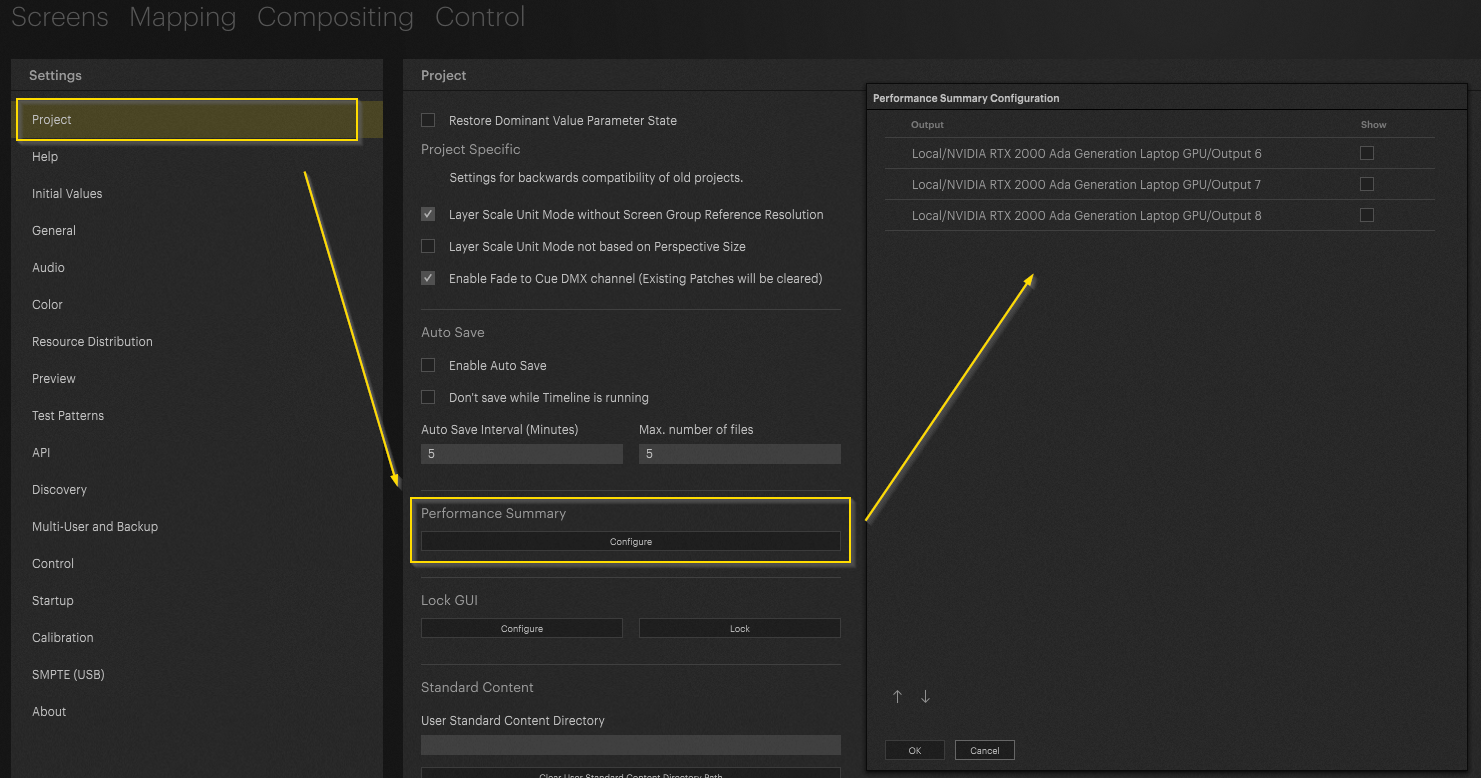
Additionally, the performance monitoring can be configured in the settings - project:
By selecting the corresponding outputs, a small performance overview will be displayed. There are three different indicator colors:
Green - everything ok
Red - Performance problems
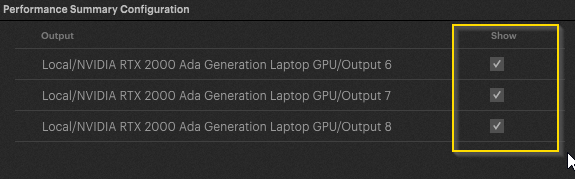
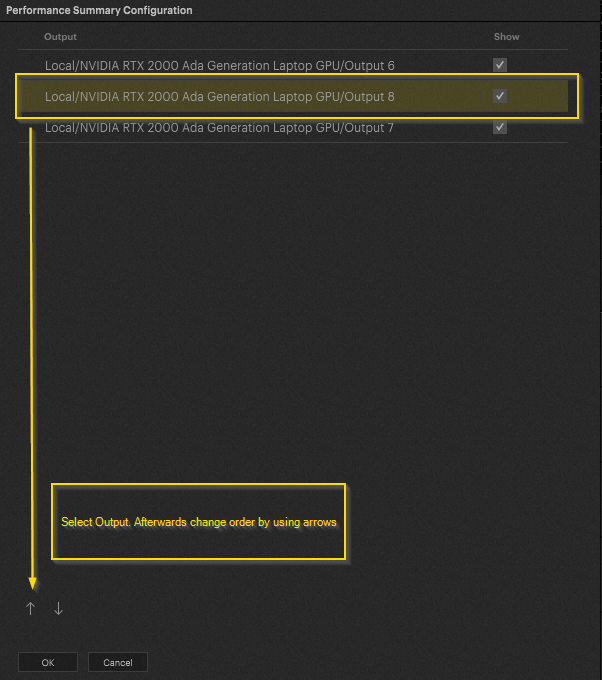
The position of the added performance metrics can be changed as well. Simply change the order by selecting the desired output and change the display position with the arrows found at the bottom:
After adding the performance monitoring to the compositing tab the live systems overview can be quick accessed from compositing:
PIXERA 1.9.136 | 19. September 2023